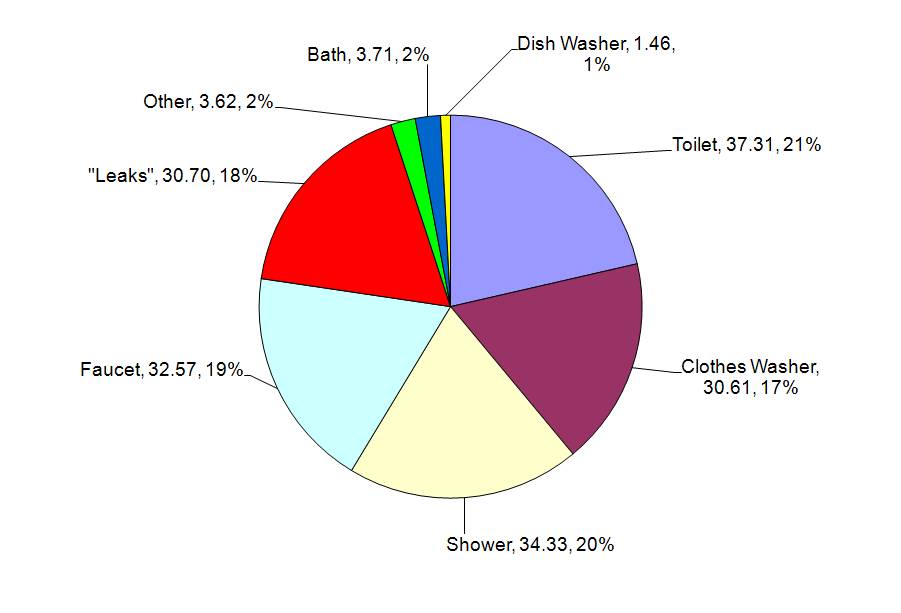
When you hold a prism up to a beam of light you suddenly see how what looks like a simple light is really composed of many separate elements. Doing an end use study has a similar effect on your water use data. Instead of just seeing aggregated demand data for customers, with perhaps some monthly data for insights into seasonal use, you will see how your residential customers are using water in a highly detailed manner. This includes how many gallons per day are being used for each end use, and how these uses compare to efficiency benchmarks.
Please review this more detailed description of a simple residential end use analyses that we could do for you. Simple SF Residential End Use Survey

